Élements de l’hyperbole (mp-geom2d)
Auteur ou autrice : Maxime Chupin.
Mise en ligne le 19 mai 2025
mp-geom2d a été écrit avec le but de proposer des macros MetaPost permettant de réaliser une figure de géométrie en collant d’assez près à une description impérative :
- Soit $A$ le point de coordonnées $(2,3)$.
- Soit $B$ le point de coordonnées $(4,5)$.
- Trace la droite $(A,B)$.
- ...
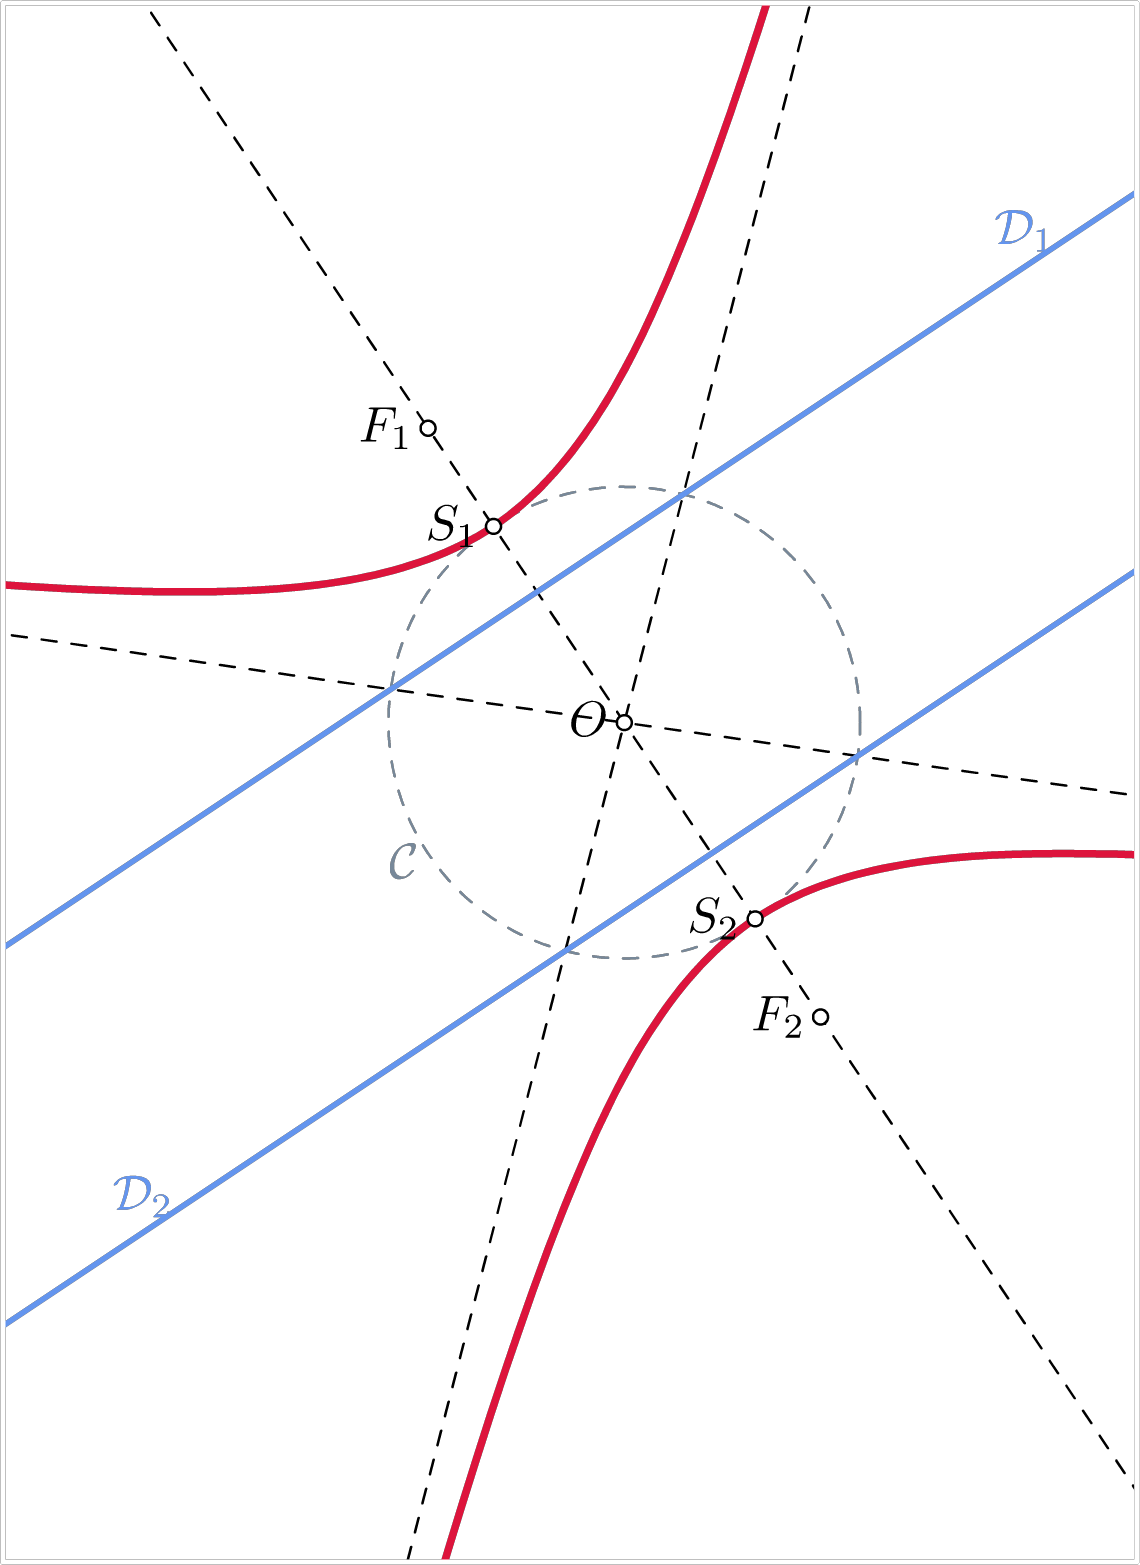
Ici, on montre les exemples de la galerie de la documentation à la fois dans l’interface en français et celle en anglais.
Code
input geom2d;

beginfig(1);
  A = Point(0,0);
  B = Point(3,2);
  AB = Droite(A,B);
  F_1 = Point(-1,1);
  Hyper = HyperboleFD(F_1,AB,1.5);
  O   = Centre(Hyper);
  F_2 = Foyer(Hyper,2);
  Axe = Droite(F_1,F_2);
  S_1 = Sommet(Hyper,1);
  S_2 = Sommet(Hyper,2);

  trace Axe dashed evenly;
  C = CerclePrincipale(Hyper) ;
  trace C avecCrayon(0.5,LightSlateGray) dashed evenly;
  A_1 = AsymptoteHyperbole(Hyper,1);
  A_2 = AsymptoteHyperbole(Hyper,2);
  trace A_1 dashed evenly;
  trace A_2 dashed evenly;

  D_1 =  Directrice(Hyper,1);
  D_2 =  Directrice(Hyper,2);

  trace D_1 avecCrayon(1.1,CornflowerBlue);
  trace D_2 avecCrayon(1.1,CornflowerBlue);
  trace DemiHyperbole(Hyper,1) avecCrayon(1.5,Crimson);
  trace DemiHyperbole(Hyper,2) avecCrayon(1.5,Crimson);

  marque.lft "O";
  marque.lft "S_1";
  marque.lft "S_2";
  marque.lft "F_1";
  marque.lft "F_2";
  label.lft(textext("\(\mathcal{C}\)"),Pt(PointDe(C,0.6)) gddEnPlace) withcolor LightSlateGray;
  label.top(textext("\(\mathcal{D}_1\)"),Pt(PointDe(D_1,0.47)) gddEnPlace) withcolor CornflowerBlue;
  label.top(textext("\(\mathcal{D}_2\)"),Pt(PointDe(D_2,0.46)) gddEnPlace) withcolor CornflowerBlue;
  Fenetre(-4,-7,4,4);
endfig;


end.


%%% English version

input geom2d;

beginfig(1);
  A = Point(0,0);
  B = Point(3,2);
  AB = Line(A,B);
  F_1 = Point(-1,1);
  Hyper = HyperbolaFD(F_1,AB,1.5);
  O   = Center(Hyper);
  F_2 = Focus(Hyper,2);
  Axe = Line(F_1,F_2);
  S_1 = Sommet(Hyper,1);
  S_2 = Sommet(Hyper,2);

  gddDraw Axe dashed evenly;
  C = PrincipalCircle(Hyper) ;
  gddDraw C withPen(0.5,LightSlateGray) dashed evenly;
  A_1 = HyperbolaAsymptote(Hyper,1);
  A_2 = HyperbolaAsymptote(Hyper,2);
  gddDraw A_1 dashed evenly;
  gddDraw A_2 dashed evenly;

  D_1 =  Directrix(Hyper,1);
  D_2 =  Directrix(Hyper,2);

  gddDraw D_1 withPen(1.1,CornflowerBlue);
  gddDraw D_2 withPen(1.1,CornflowerBlue);
  gddDraw SemiHyperbola(Hyper,1) withPen(1.5,Crimson);
  gddDraw SemiHyperbola(Hyper,2) withPen(1.5,Crimson);

  gddMark.lft "O";
  gddMark.lft "S_1";
  gddMark.lft "S_2";
  gddMark.lft "F_1";
  gddMark.lft "F_2";
  gddLabel.lft(textext("\(\mathcal{C}\)"),PointDe(C,0.6)) withcolor LightSlateGray;
  gddLabel.top(textext("\(\mathcal{D}_1\)"),PointDe(D_1,0.47)) withcolor CornflowerBlue;
  gddLabel.top(textext("\(\mathcal{D}_2\)"),PointDe(D_2,0.46)) withcolor CornflowerBlue;
  Window(-4,-7,4,4);
endfig;


end.
Mots clés : géométriehyperbolemp-geom2d
Cet exemple fait partie de la collection d’exemples Documentation de mp-geom2d