Une cordioïde (mp-geom2d)
Auteur ou autrice : Jean-Michel Sarlat.
Mise en ligne le 19 mai 2025
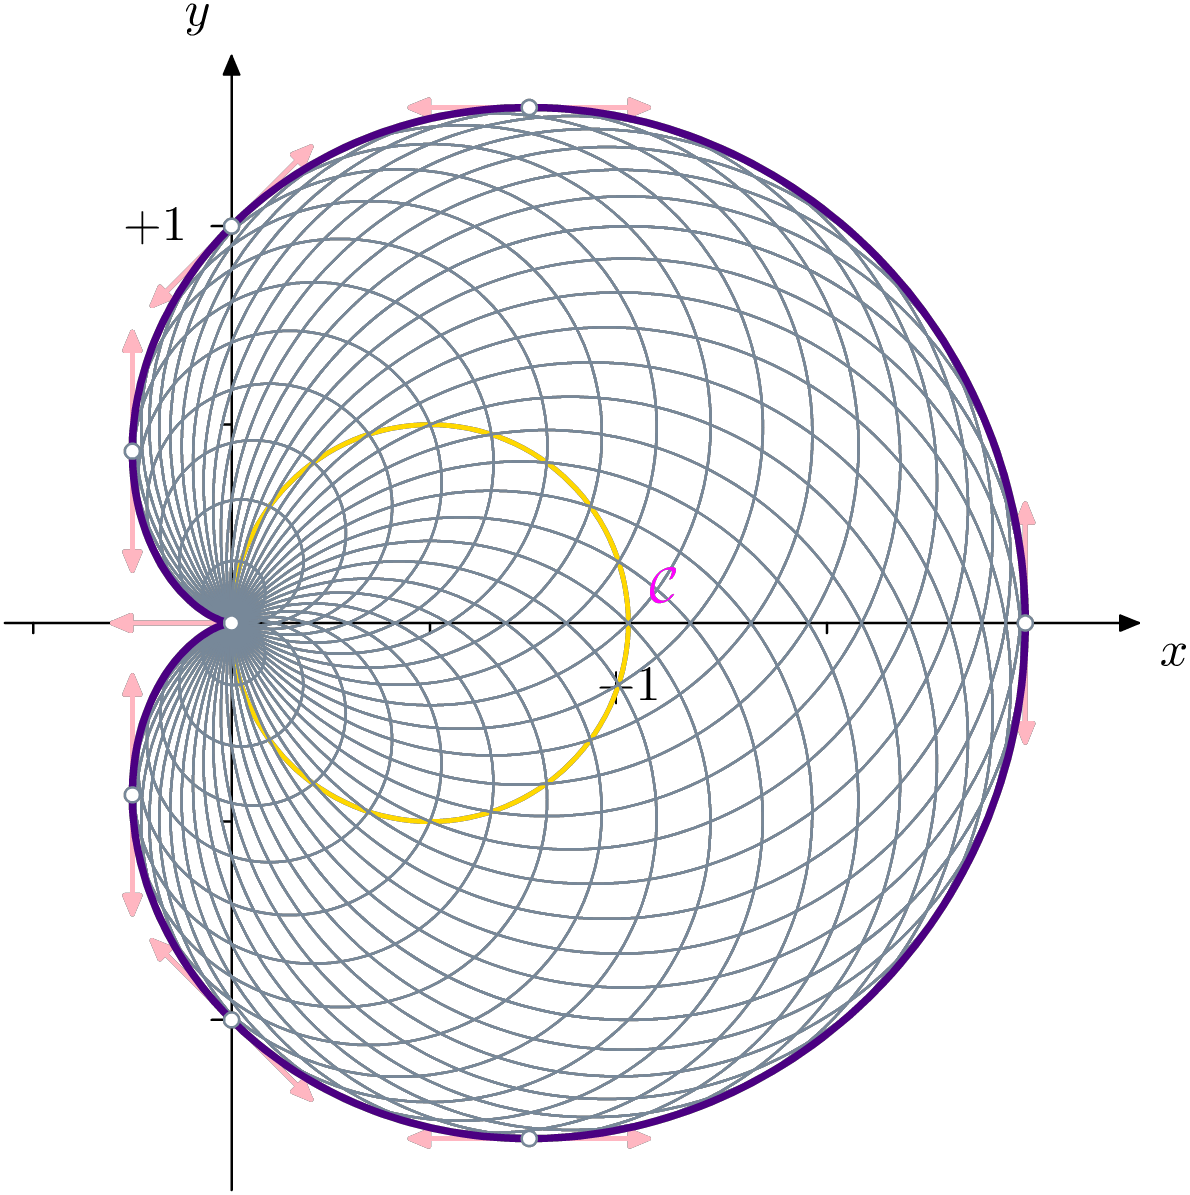
mp-geom2d a été écrit avec le but de proposer des macros MetaPost permettant de réaliser une figure de géométrie en collant d’assez près à une description impérative :
- Soit $A$ le point de coordonnées $(2,3)$.
- Soit $B$ le point de coordonnées $(4,5)$.
- Trace la droite $(A,B)$.
- ...
Ici, on montre les exemples de la galerie de la documentation à la fois dans l’interface en français et celle en anglais.
Code
input geom2d;

labeloffset := 6;
gddU:=0.8cm;

vardef r(expr t) = 1+cos(t) enddef;
vardef rp(expr t) = (r(t)*cos(t),r(t)*sin(t)) enddef;

def traceDoubleVecteur(expr o,d)= drawdblarrow ((o-d)--(o+d)) gddEnPlace enddef;

beginfig(1);
 Repere(10,10,2,5,3.5,3.5);
 Axes;
 Debut;
  Graduations; Unites(1);

  drawoptions(withcolor LightSlateGrey);
  draw fullcircle shifted (0.5,0) gddEnPlace avecCrayon(1,Gold);

  nb = 80;
  pas = 2Pi / nb;
  for i=0 upto nb:
    theta := i * pas;
    draw (fullcircle scaled 2cos(theta)
      shifted (cos(theta)*cos(theta),cos(theta)*sin(theta))) gddEnPlace;
  endfor;


  traceDoubleVecteur(rp(0),(0,0.3)) avecCrayon(1,LightPink);
  traceDoubleVecteur(rp(Pi/3),(0.3,0)) avecCrayon(1,LightPink);
  traceDoubleVecteur(rp(Pi/2),(0.2,0.2)) avecCrayon(1,LightPink);
  traceDoubleVecteur(rp(2Pi/3),(0,0.3)) avecCrayon(1,LightPink);
  traceDoubleVecteur(rp(-Pi/3),(0.3,0)) avecCrayon(1,LightPink);
  traceDoubleVecteur(rp(-Pi/2),(0.2,-0.2)) avecCrayon(1,LightPink);
  traceDoubleVecteur(rp(-2Pi/3),(0,0.3)) avecCrayon(1,LightPink);

  fleche Segment(origine,(-0.3,0)) avecCrayon(1,LightPink);
  trace CourbeEnPolaires(r,-Pi,Pi,100) avecCrayon(1.5,Indigo);

  pointe Point(0,0);
  pointe Point(2,0);
  pointe PairTOPoint(rp(Pi/3));
  pointe PairTOPoint(rp(-Pi/3));
  pointe PairTOPoint(rp(2Pi/3));
  pointe PairTOPoint(rp(-2Pi/3));
  pointe Point(0,1);
  pointe Point(0,-1);

  label.urt(textext("\(\mathcal{C}\)"),PtR(Point(1,0))) withcolor Magenta;
 Fin;
endfig;
end

% %%% English version

input geom2d;

labeloffset := 6;
gddU:=0.8cm;

vardef r(expr t) = 1+cos(t) enddef;
vardef rp(expr t) = (r(t)*cos(t),r(t)*sin(t)) enddef;

def DrawDoubleVector(expr o,d)= drawdblarrow ((o-d)--(o+d)) gddInPlace enddef;

beginfig(1);
 Frame(10,10,2,5,3.5,3.5);
 Axis;
 gddBegin;
  Graduations; Units(1);

  drawoptions(withcolor LightSlateGrey);
  draw fullcircle shifted (0.5,0) gddInPlace withPen(1,Gold);

  nb = 80;
  pas = 2Pi / nb;
  for i=0 upto nb:
    theta := i * pas;
    draw (fullcircle scaled 2cos(theta)
      shifted (cos(theta)*cos(theta),cos(theta)*sin(theta))) gddInPlace;
  endfor;


  DrawDoubleVector(rp(0),(0,0.3)) withPen(1,LightPink);
  DrawDoubleVector(rp(Pi/3),(0.3,0)) withPen(1,LightPink);
  DrawDoubleVector(rp(Pi/2),(0.2,0.2)) withPen(1,LightPink);
  DrawDoubleVector(rp(2Pi/3),(0,0.3)) withPen(1,LightPink);
  DrawDoubleVector(rp(-Pi/3),(0.3,0)) withPen(1,LightPink);
  DrawDoubleVector(rp(-Pi/2),(0.2,-0.2)) withPen(1,LightPink);
  DrawDoubleVector(rp(-2Pi/3),(0,0.3)) withPen(1,LightPink);

  gddArrow Segment(origine,(-0.3,0)) withPen(1,LightPink);
  gddDraw PolarCurve(r,-Pi,Pi,100) withPen(1.5,Indigo);

  gddDrawPoint Point(0,0);
  gddDrawPoint Point(2,0);
  gddDrawPoint PairTOPoint(rp(Pi/3));
  gddDrawPoint PairTOPoint(rp(-Pi/3));
  gddDrawPoint PairTOPoint(rp(2Pi/3));
  gddDrawPoint PairTOPoint(rp(-2Pi/3));
  gddDrawPoint Point(0,1);
  gddDrawPoint Point(0,-1);

  gddLabel.urt(textext("\(\mathcal{C}\)"),(1,0)) withcolor Magenta;
 gddEnd;
endfig;
end
Mots clés : cardioïdecerclesgéométriemp-geom2d
Cet exemple fait partie de la collection d’exemples Documentation de mp-geom2d